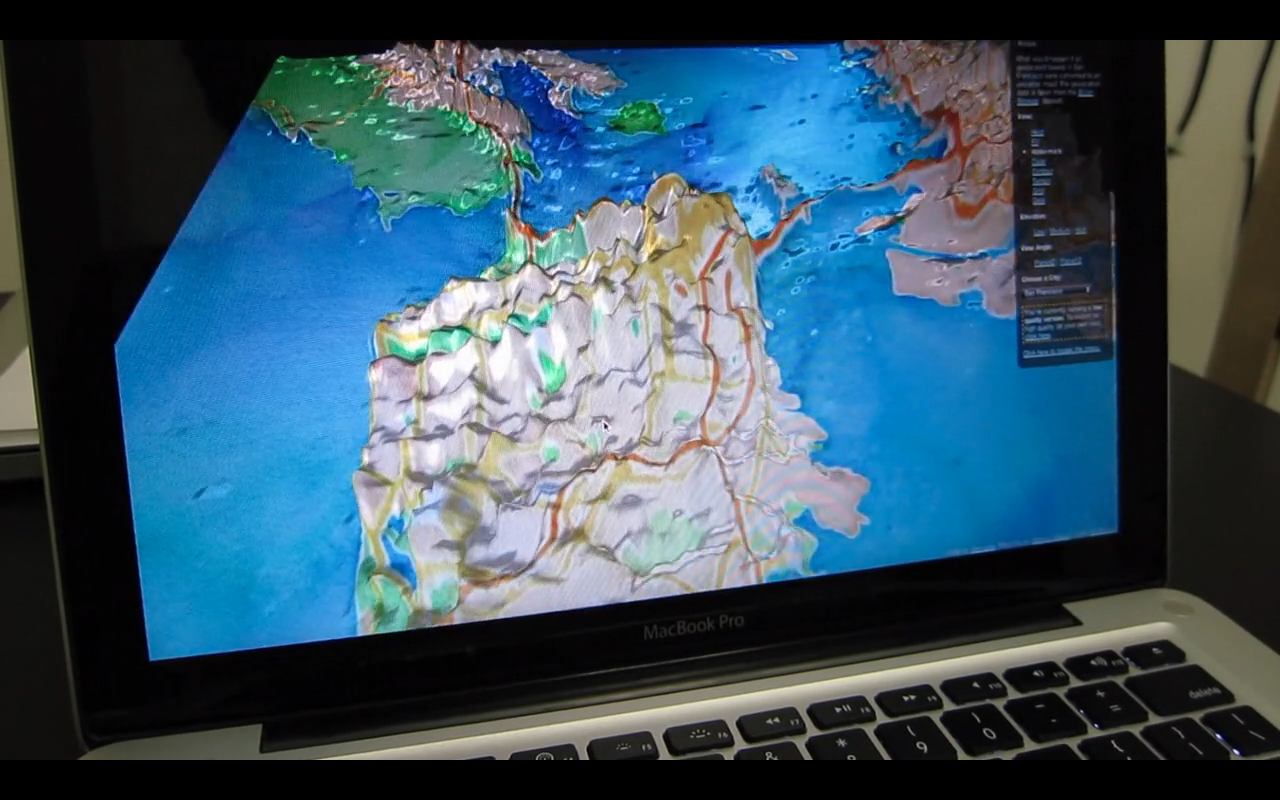
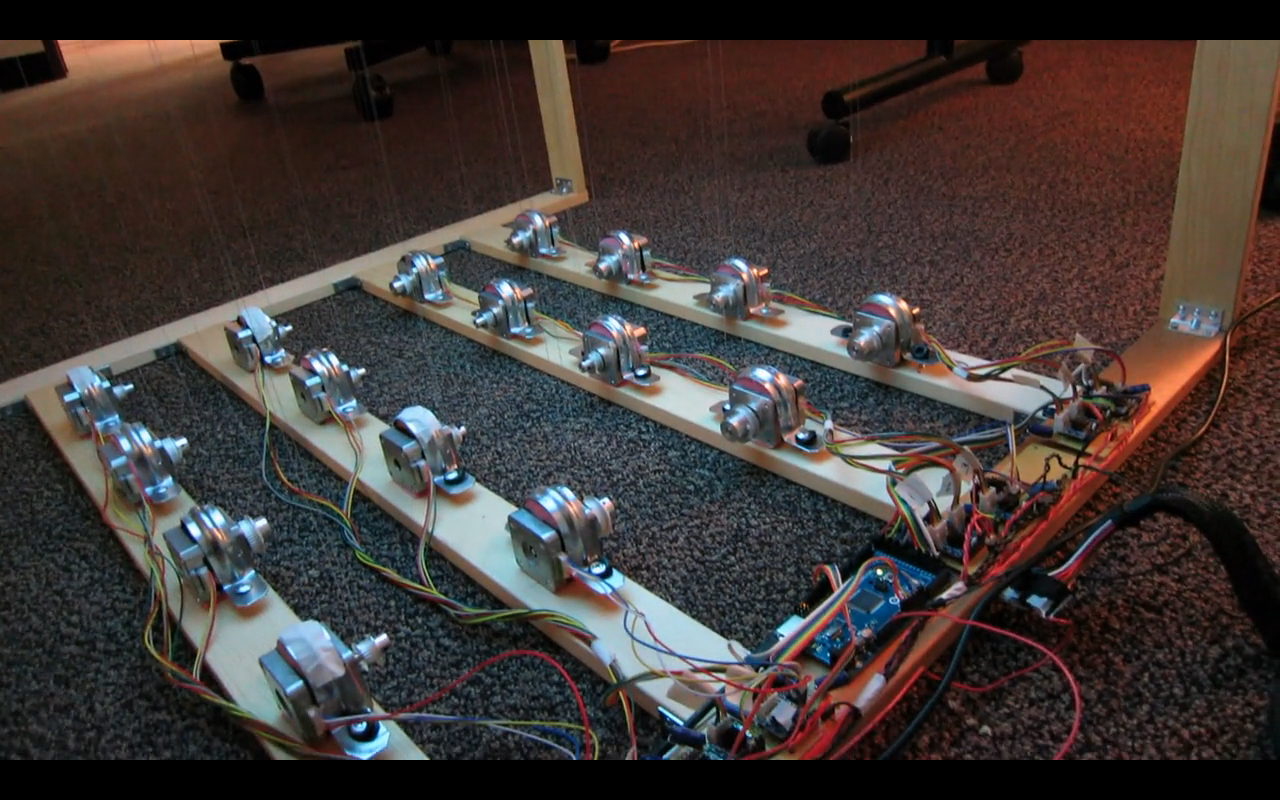
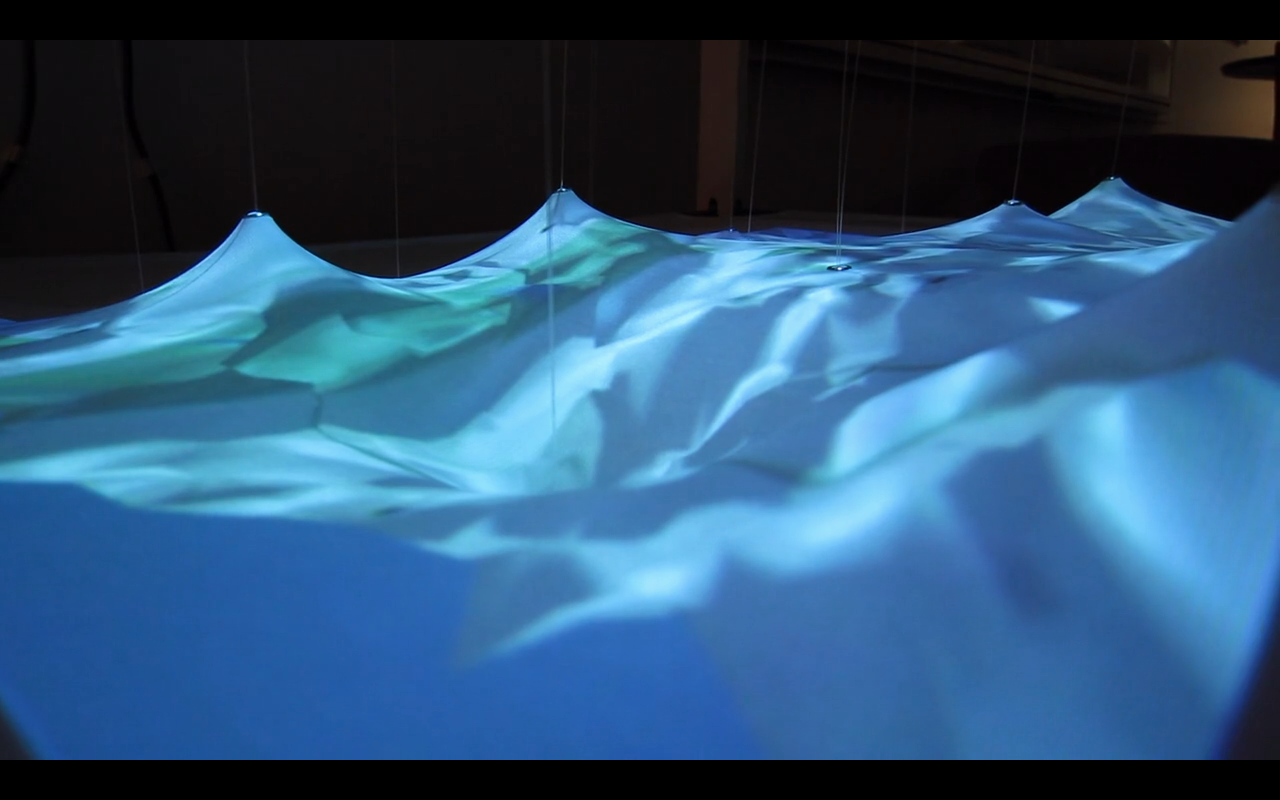
An experiment in spatial topology. A map of Boston is projected over a spandex surface. Peaks and valleys on the map change in real time based on concentrations of Twitter usage in an area. The motors underneath the projection deform the screen to reflect a spatial demonstration of these changes in Twitter usage density.
This project was an attempt to map realtime map data onto a volumetric surface. Due to limitations and occlusions when viewing 3D data on a 2D screen, we sought to imagine what a spatial representation of 3D map data might look like to depict the current status of a region.
Created as an artist researcher at IBM's Center for Visual Analytics in Cambridge, Massachusetts.
Dynamic Data Sculpture
2014
Tools: Arduino, Motors, JavaScript, Projector
Works / Dynamic Data Sculpture